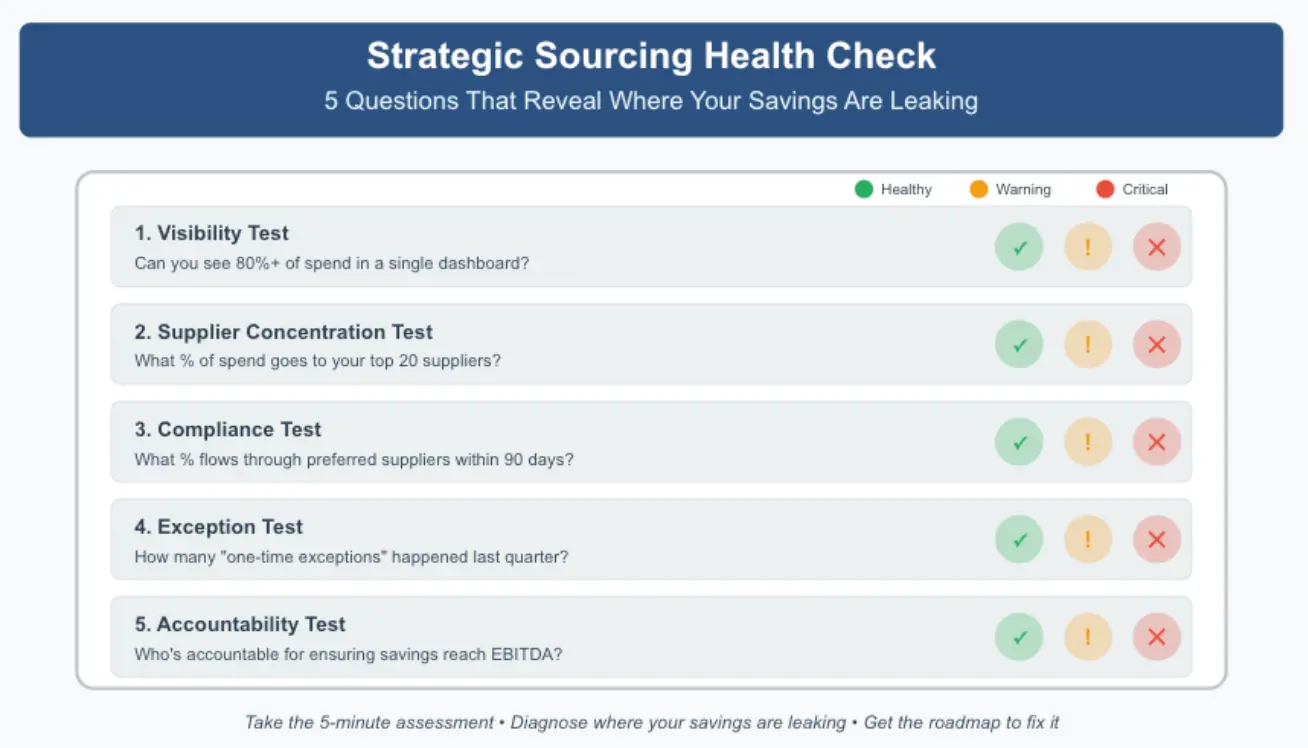
Before you invest another dollar in strategic sourcing, answer these five questions.
Your answers will tell you whether your procurement savings are actually reaching your bottom line—or evaporating en route.
Why This Matters
Most companies don’t have a strategic sourcing problem. They have a savings realization problem.
The procurement team negotiates well. The contracts look great. The savings projections are impressive. But somehow, EBITDA doesn’t improve proportionally.
The gap between “savings signed” and “savings realized” is where value dies.
This five-question health check will diagnose exactly where your organization sits on the spectrum from “savings are fiction” to “savings are locked in.”
It takes five minutes. The insights could be worth millions.
The Framework
For each question, you’ll find three possible states:
🟢 Healthy: Your strategic sourcing is working. Keep optimizing.
🟡 Warning: You’re leaving money on the table. Action needed.
🔴 Critical: Your procurement savings are largely fictional. Time for a reset.
Be brutally honest with your answers. The goal isn’t to look good—it’s to identify where value is leaking so you can fix it.
Question 1: The Visibility Test
“Can you see 80%+ of your spend in a single dashboard, with data that’s current within 30 days?”
🟢 Healthy: Yes, with real-time or near-real-time data across all major categories and locations.
🟡 Warning: Yes, but the data is 30-60 days old, or we’re missing visibility into 20-40% of spend.
🔴 Critical: No. Our spend data is scattered across multiple systems, or we only have visibility into major categories, or our data is more than 60 days old.
Why It Matters
If you can’t see your spend, you can’t manage it. Period.
Companies with poor spend visibility face three compounding problems:
First, you can’t identify opportunities. Strategic sourcing starts with understanding where money is going. Without comprehensive visibility, you’re negotiating blind—focusing on obvious categories while missing the real opportunities.
Second, you can’t measure compliance. After signing a new contract, can you see whether buyers are actually using the preferred supplier? If your data is 60 days old, you’re discovering problems two months too late.
Third, you can’t validate savings. When procurement reports “$2M in savings,” finance should be able to reconcile that against actual spend data. If the systems don’t connect, the savings claims are just estimates—and often wildly optimistic ones.
What Good Looks Like
Leading organizations have:
Unified spend visibility across 85-95% of addressable spend
Data refreshed at least monthly, ideally weekly or daily for high-velocity categories
Drill-down capability from total spend → category → supplier → transaction
Integration between procurement systems and financial systems
If You’re Not There Yet
Start with spend consolidation. Even if you can’t get real-time data immediately, getting a comprehensive view of the last 12 months of spend is the foundation for everything else.
Our Spend Cube Review does exactly this—and it’s zero-cost, no obligation. We’ll show you where your money is going and where opportunities exist.
Question 2: The Supplier Concentration Test
“What percentage of your total spend goes to your top 20 suppliers?”
🟢 Healthy: 60-80% (the Pareto sweet spot)
🟡 Warning: 40-60% or 80-90%
🔴 Critical: Less than 40% (too fragmented) or more than 90% (too concentrated)
Why It Matters
This ratio reveals strategic sourcing maturity and risk exposure.
Too fragmented (under 60%): You have hundreds or thousands of small suppliers, which means:
No leverage in negotiations—you’re not important to any single supplier
High administrative overhead managing relationships and contracts
Inconsistent quality and service levels
Difficulty enforcing compliance and standards
One manufacturing client had 840 active suppliers. Their procurement team spent 70% of their time on administrative tasks (onboarding, payments, compliance checks) and only 30% on strategic sourcing. After rationalization down to 240 suppliers, they freed up capacity and increased their leverage—generating 15% additional savings.
Too concentrated (over 85%): You’ve consolidated, but now you face different risks:
Single points of failure—one supplier disruption cripples operations
Reduced competitive tension—suppliers know you can’t easily switch
Price creep over time as your negotiating leverage diminishes
The sweet spot is 60-80%. You have enough concentration to matter to your suppliers and drive favorable terms, but enough diversification to maintain competition and manage risk.
What Good Looks Like
Best-in-class procurement organizations:
Actively manage their supplier portfolio with intentional concentration targets
Have backup suppliers identified for critical categories
Regularly review supplier performance and make switches when needed
Balance leverage (concentration) with resilience (diversification)
If You’re Not There Yet
Conduct a supplier rationalization analysis. Identify which suppliers represent low spend but high administrative overhead. Look for consolidation opportunities where multiple small suppliers can be replaced by one strategic partner.
But don’t over-consolidate. Keep competition alive in your most important categories.
Question 3: The Compliance Test
“What percentage of category spend actually flows through preferred suppliers within 90 days after a new contract is signed?”
🟢 Healthy: 85%+ within 90 days
🟡 Warning: 60-85% within 90 days
🔴 Critical: Less than 60%, or “we don’t measure this”
Why It Matters
This is where savings evaporate. This is the test that separates strategic sourcing theater from actual value creation.
You can negotiate the best contract in the world, but if only 50% of purchases flow through that contract, you’ve captured only 50% of the value. The other half is still going to old, more expensive suppliers.
The brutal reality: In organizations that don’t actively measure and manage compliance, preferred supplier adoption typically hovers around 45-60%. That means 40-55% of the negotiated savings never materialize.
Why does this happen?
Inertia: Buyers use familiar suppliers out of habit
Systems: Old suppliers remain “approved” in purchasing systems
Awareness: Frontline employees don’t know about the new contract
Friction: The preferred supplier is harder to use than alternatives
Resistance: Department heads prefer their existing relationships
What Good Looks Like
Companies that achieve 85%+ compliance within 90 days:
Update purchasing systems immediately after contract signature
Make preferred suppliers the default option (not just “available”)
Communicate changes clearly to all buyers and stakeholders
Track compliance weekly and intervene when patterns emerge
Address root causes of non-compliance, not just symptoms
If You’re Not There Yet
Start measuring. You can’t improve what you don’t track.
Pull spend data for the last three major contracts you signed. Compare actual spend to the supplier over the following 90 and 180 days against the baseline. Calculate the compliance rate.
If it’s below 70%, you have an implementation problem, not a negotiation problem. Invest your energy accordingly.
Question 4: The Exception Test
“How many ‘one-time exceptions’ to strategic sourcing contracts happened last quarter?”
🟢 Healthy: Less than 5% of transactions, all documented with business justification and approved through a defined process
🟡 Warning: 5-15% of transactions, with some undocumented or unclear approval process
🔴 Critical: More than 15%, or “we don’t track exceptions”
Why It Matters
Death by a thousand cuts. Each exception seems small and justified. Collectively, they destroy your strategic sourcing business case.
Here’s how it typically unfolds:
Month 1 after contract signature: A project manager needs something urgently. The preferred supplier can’t deliver fast enough. Exception approved. Reasonable.
Month 2: A different manager has a “unique requirement” that the preferred supplier doesn’t stock. Exception approved. Also reasonable.
Month 3: Someone discovers they can get slightly faster service from their old supplier. Exception requested and approved. Still seems reasonable.
By Month 6, exceptions represent 25% of category spend. Your strategic sourcing win has been nickeled-and-dimed into irrelevance.
The problem isn’t that exceptions exist—sometimes they’re genuinely necessary. The problem is ungoverned exceptions that face no scrutiny and accumulate unchecked.
What Good Looks Like
Organizations with strong exception governance:
Define clearly what constitutes a valid exception (e.g., preferred supplier can’t meet technical specs, delivery timing is mission-critical, cost difference exceeds X%)
Require documented business justification for every exception
Have tiered approval authority based on exception dollar value
Track exception rates by department and category
Review exception patterns quarterly to identify systemic issues
If a particular department has consistently high exception rates, that’s a signal. Either they have unique needs that weren’t considered in the sourcing strategy, or they’re gaming the system.
If You’re Not There Yet
Implement exception tracking immediately. Create a simple log with:
Date and requester
Dollar value
Reason for exception
Approver
Category
Review monthly. Any category or department with exception rates above 10% needs investigation.
Then tighten approval thresholds. Make exceptions slightly harder to get—not impossible, but requiring conscious effort and justification.
Question 5: The Accountability Test
“Who in your organization is personally accountable for ensuring negotiated savings show up in EBITDA?”
🟢 Healthy: Clear owner with decision authority, cross-functional visibility, and incentives tied to realized savings (not just negotiated savings)
🟡 Warning: Shared responsibility between procurement and finance, or accountability exists but incentives are misaligned
🔴 Critical: “The procurement team?” or unclear ownership, or no one is specifically accountable for savings realization
Why It Matters
If everyone owns it, no one owns it.
Strategic sourcing spans multiple functions: procurement negotiates, IT implements systems, operations executes, finance measures. When accountability is diffuse, gaps emerge between functions—and savings leak through those gaps.
The most common failure pattern:
Procurement team negotiates and reports savings → “Our job is done”
IT team enables the contract in systems → “We built what was requested”
Operations team uses suppliers → “We’re just following the process”
Finance team sees flat EBITDA → “We don’t understand why savings aren’t showing up”
Everyone did their job. No one is accountable for the outcome. The savings evaporated.
What Good Looks Like
Best-in-class organizations assign clear ownership:
Single point of accountability: One person (often a VP of Strategic Sourcing, VP of Operations, or Chief Procurement Officer) owns end-to-end savings realization—from contract signature through EBITDA impact.
Cross-functional authority: This person has influence (if not direct authority) across procurement, operations, IT, and finance to drive implementation.
Aligned incentives: Compensation includes a significant component tied to realized savings validated by finance—not just negotiated savings claimed by procurement.
Regular reconciliation: Monthly meetings between procurement and finance to reconcile savings claims against actual spend, with variance analysis and corrective action plans.
Escalation authority: When implementation barriers arise, this person can escalate to the executive team and get resources or decisions needed to unlock progress.
If You’re Not There Yet
Start by naming the owner. Even if you can’t restructure incentives immediately, having one person clearly accountable for savings realization changes the dynamic.
Then create a monthly reconciliation process. Procurement brings savings claims. Finance brings actual spend data. Together, they validate what’s real and what’s not.
Finally, address incentive misalignment. If your procurement team’s bonuses are based on “savings signed,” don’t be surprised when implementation isn’t their priority. Shift to incentives based on realized savings—even if it’s a gradual transition.
Scoring Your Health Check
Count your green, yellow, and red responses:
4-5 Green Responses: Strategic Sourcing is Working
Your situation: You have strong fundamentals in place. Savings are largely reaching your bottom line. You’re in the top quartile of organizations.
Your opportunity: Optimization. Look for the next 10-15% improvement through advanced analytics, supplier innovation, or expanding your strategic sourcing scope to additional categories.
Next step: Consider our advanced optimization consulting to help you move from good to great. Or explore how to replicate your success across other business units or portfolio companies.
2-3 Green Responses: Money on the Table
Your situation: You’re generating savings, but significant value is leaking. You’re probably realizing 40-60% of negotiated savings—which means you’re leaving 40-60% on the table.
Your opportunity: Workflow redesign and implementation discipline. The negotiation capability is there; the operational integration isn’t. This is fixable with focused effort on the right leakage points.
Next step: Our Consulting Projects engagement can fix this in 90 days. We’ll identify your specific leakage points, redesign workflows to lock in savings, and implement governance to keep them locked in.
0-1 Green Response: Strategic Sourcing is Theater
Your situation: Your procurement savings are largely fictional. You’re probably realizing less than 30% of negotiated savings, and you lack visibility into where the other 70% is going.
Your opportunity: Complete reset. You need foundational work on spend visibility, supplier rationalization, and basic governance before advanced strategic sourcing will deliver value.
Next step: Start with our zero-risk, no-cost Spend Cube Review. In two weeks, you’ll have:
Clear visibility into where your spend is going
Identification of where savings are leaking
Prioritized roadmap for improvement
Quantified opportunity for EBITDA impact
What To Do Next
Start with the Spend Cube Review
Regardless of your score, comprehensive spend visibility is the foundation.
Our Spend Cube Review provides:
✅ 2-week turnaround from data receipt to insights delivery
✅ Zero cost, no obligation – this is a diagnostic, not a sales pitch
✅ Requires only an NDA – we don’t need sensitive pricing details, just spend patterns
✅ Actionable insights – you’ll know exactly where opportunities exist and which leakage points to address first
The 7-Step Process:
Spend Cube Review: Analyze historical spend, demand drivers, and supplier landscape
Supply Market Analysis: Understand market trends, potential suppliers, and supplier segmentation
Sourcing Strategy: Make-vs-Buy decisions, negotiation strategies, award criteria
Supplier Portfolio: Identify and qualify suppliers through RFI or pre-qualification process
Supplier Engagement: Issue RFPs, run bid process, evaluate suppliers
Negotiate and Select: Negotiations, finalize terms, select preferred suppliers
Implement and Track: Formalize contracts, onboard suppliers, monitor performance
Most organizations jump straight to steps 5-7. Then they wonder why savings don’t materialize.
We start at step 1. Because without the foundation, everything else is theater.
Beyond the Spend Cube: Two Paths Forward
Once you have clarity from the Spend Cube Review, we offer two engagement models:
Consulting Projects
Best for: Organizations that know what needs to be fixed and want expert execution
Defined scope and timeline, typically 90-180 days. We come in, solve the specific problem (workflow redesign, supplier rationalization, governance implementation), transfer knowledge to your team, and exit.
Fixed fee. Clear deliverables. Measurable outcomes.
Consulting as a Service (CaaS)
Best for: Organizations that need ongoing strategic and operational expertise without the overhead of a full executive team
Our fractional model embeds deep strategic and operational expertise at a fixed monthly fee. You get seasoned hands-on strategy leaders where you need them most—whether that’s fractional CPO, VP of Strategic Sourcing, or operational excellence leadership.
Perfect for small- and mid-market organizations and PE portfolio companies that need executive-level talent without executive-level overhead.
The Bottom Line
Strategic sourcing without operational discipline is just theater.
You can negotiate all day. You can sign impressive contracts. You can build beautiful PowerPoint decks showing projected savings.
But if the savings don’t show up in EBITDA, none of it matters.
This health check gives you clarity on where you stand. The Spend Cube Review gives you visibility into where value is leaking. And our systematic approach locks in the savings so they actually reach your bottom line.
Don’t negotiate another contract until you can ensure the savings will stick.
Take Action Now
Email me: amelia@edso-edge.com
Subject line: “Spend Cube Health Check”
Include your five-question scores in the email, and we’ll schedule a 30-minute call to discuss your specific situation and whether the Spend Cube Review makes sense for you.
Or if you’re ready to move forward immediately, just say “Let’s start the Spend Cube Review” and we’ll send over the NDA and data request template.
One More Thing
If you found this health check valuable, you’ll want to read the full article:
Strategic Sourcing's Dirty Secret: Why Your Procurement Wins Don't Show Up in EBITDA
It breaks down the five leakage points in detail, with real examples and the systematic approach we use to lock in savings.
Because understanding where you are (this health check) is step one. Understanding why savings leak (the article) is step two. Fixing it (our engagement) is step three.
Let’s get started.
Amelia Waters is Managing Partner at EDSO Edge, where she partners with SMBs and PE portfolio companies to deliver measurable EBITDA impact through monetization strategy, complexity reduction, and strategic sourcing. With experience at Boston Consulting Group and two decades of operational leadership, she specializes in translating strategy into simplified, scalable operations. Connect with her on LinkedIn or visit www.edso-edge.com.